Maximize Business Performance through Data-Driven Strategies
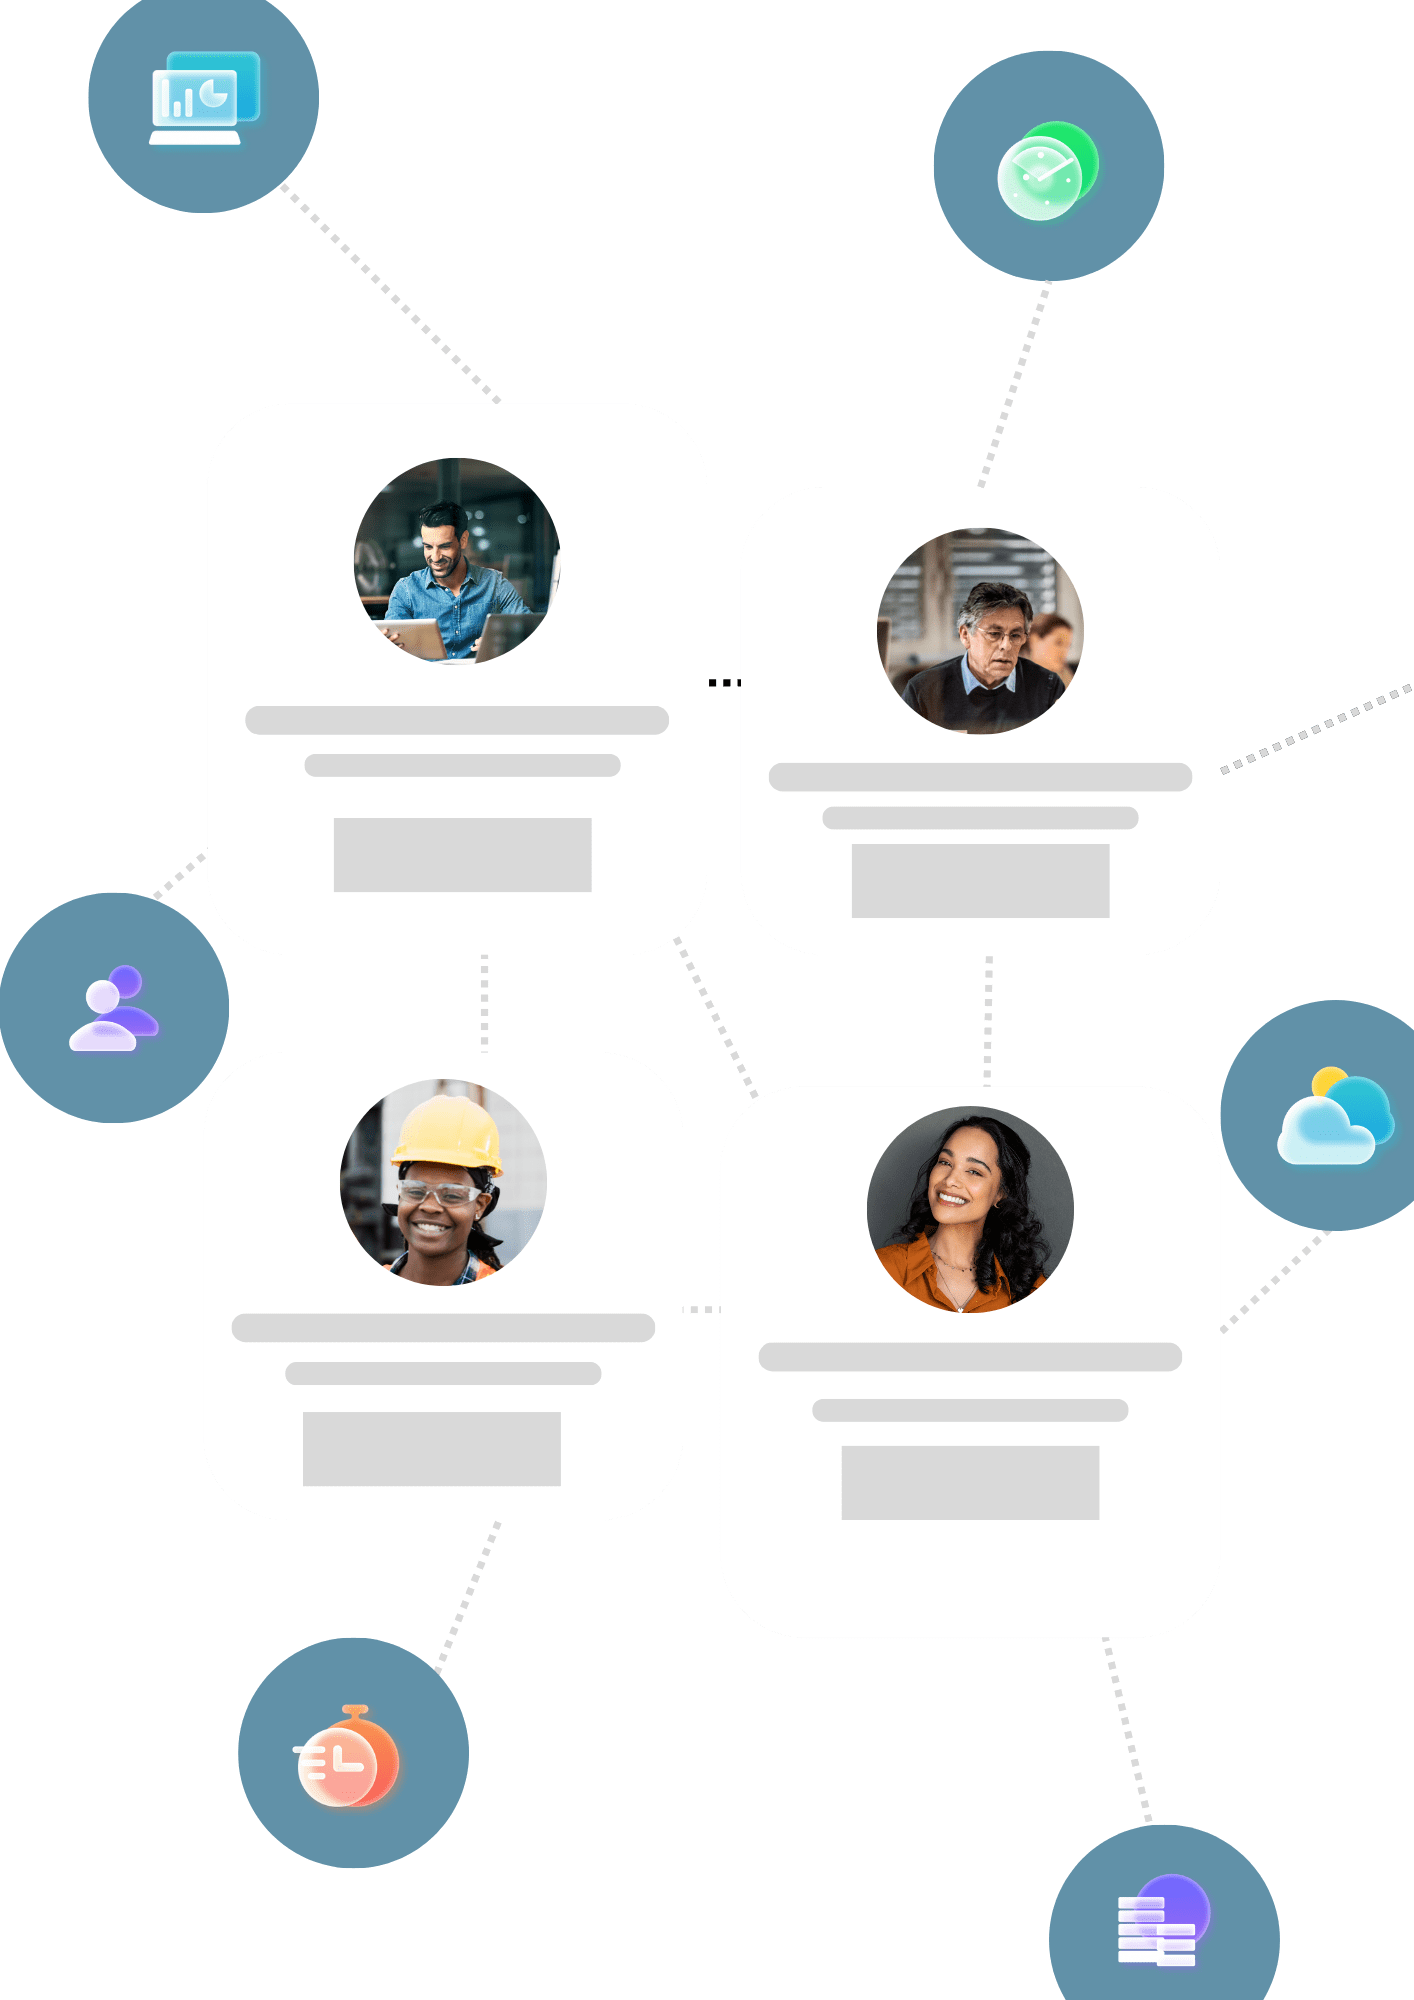
At Accienta, we help you gather the most relevant data needed for your business and provide specific techniques and solutions to help your stakeholders understand and use data analysis and methodology to collect and gather data to help you strategize your business more effectively.

Maximize Business Performance through Data-Driven Strategies

At Accienta, we help you gather the most relevant data needed for your business and provide specific techniques and solutions to help your stakeholders understand and use data analysis and methodology to collect and gather data to help you strategize your business more effectively.
Benefits of Using Data Analysis and Methodology
Data analysis allows organizations to make data-driven decisions by providing insights into trends, patterns, and relationships within data sets.
With data analysis methodologies such as machine learning and predictive modeling, businesses can forecast future trends and outcomes. This can help in strategic planning and risk management.
By analyzing operational data, companies can identify bottlenecks, inefficiencies, and areas for improvement in their processes. This can lead to increased productivity and cost savings.
Data analysis can offer valuable market insights, helping businesses understand customer behavior, competitors’ strategies, and market trends. This can provide a significant competitive edge.
Data analysis methodologies can help companies understand customer preferences, habits, and pain points, enabling them to improve their products, services, and customer interactions.
Through data analysis, businesses can identify potential risks and develop strategies to mitigate them. This includes financial risks, operational risks, and even cybersecurity threats.
Data analysis can segment customers based on their behaviors, preferences, and past purchases, enabling businesses to create more targeted and personalized marketing campaigns.
Data analysis can segment customers based on their behaviors, preferences, and past purchases, enabling businesses to create more targeted and personalized marketing campaigns.
Why Hire Accienta?
With our extensive knowledge and experience when it comes to software solutions across various industries, we understand your the common challenges, best practices and potential pitfalls of digital transformation. With that in mind, we understand your platform needs, and we are here to help you tailor that SaaS solution to your business while we integrate that with your existing systems.

Understanding the Basics
The first step involves understanding the basics of data analysis. This could include introductions to data types, how data is collected, and why data analysis is important. It could also involve introducing essential tools and software used in data analysis, such as Excel or Python.

Data Collection Methods
Next, trainees learn about various data collection methods. This might involve learning about surveys, experiments, observations, and secondary data sources, as well as the pros and cons of each method.

Data Cleaning and Preparation
Once data is collected, it often needs to be cleaned and prepared before analysis. This step involves learning how to handle missing data, deal with outliers, and ensure that data is in a suitable format for analysis.

Descriptive Statistics
Trainees are then introduced to descriptive statistics, which summarize and describe data. This includes measures of central tendency like the mean, median, and mode, as well as measures of variability like range, variance, and standard deviation.

Inferential Statistics
The next step is learning about inferential statistics, which involve making predictions or inferences about a population based on a sample of data. This might involve learning about hypothesis testing, correlation, regression, and various statistical tests.

Data Visualization
Visualization is a key part of data analysis, as it helps to communicate findings effectively. This step involves learning about different types of charts and graphs, as well as tools for creating visualizations, such as Tableau.

Interpretation and Reporting
The final step in data analysis is interpreting the results and reporting them. This involves learning how to draw conclusions from statistical analyses, as well as how to communicate these results to others, both in writing and verbally.

Practice and Application
Throughout the training process, trainees should have opportunities to practice these skills on real or simulated datasets. This could involve completing exercises, working on projects, or analyzing case studies.

Ongoing Learning and Development
Data analysis is a rapidly evolving field, so it's important for trainees to continue learning and developing their skills even after the training program is complete. This might involve learning about more advanced techniques, or keeping up with new tools and software as they emerge.

Understanding the Basics
The first step involves understanding the basics of data analysis. This could include introductions to data types, how data is collected, and why data analysis is important. It could also involve introducing essential tools and software used in data analysis, such as Excel or Python.

Data Collection Methods
Next, trainees learn about various data collection methods. This might involve learning about surveys, experiments, observations, and secondary data sources, as well as the pros and cons of each method.

Data Cleaning and Preparation
Once data is collected, it often needs to be cleaned and prepared before analysis. This step involves learning how to handle missing data, deal with outliers, and ensure that data is in a suitable format for analysis.

Descriptive Statistics
Trainees are then introduced to descriptive statistics, which summarize and describe data. This includes measures of central tendency like the mean, median, and mode, as well as measures of variability like range, variance, and standard deviation.

Inferential Statistics
The next step is learning about inferential statistics, which involve making predictions or inferences about a population based on a sample of data. This might involve learning about hypothesis testing, correlation, regression, and various statistical tests.

Data Visualization
Visualization is a key part of data analysis, as it helps to communicate findings effectively. This step involves learning about different types of charts and graphs, as well as tools for creating visualizations, such as Tableau.

Interpretation and Reporting
The final step in data analysis is interpreting the results and reporting them. This involves learning how to draw conclusions from statistical analyses, as well as how to communicate these results to others, both in writing and verbally.

Practice and Application
Throughout the training process, trainees should have opportunities to practice these skills on real or simulated datasets. This could involve completing exercises, working on projects, or analyzing case studies.

Ongoing Learning and Development
Data analysis is a rapidly evolving field, so it's important for trainees to continue learning and developing their skills even after the training program is complete. This might involve learning about more advanced techniques, or keeping up with new tools and software as they emerge.

Understanding the Basics
The first step involves understanding the basics of data analysis. This could include introductions to data types, how data is collected, and why data analysis is important. It could also involve introducing essential tools and software used in data analysis, such as Excel or Python.

Data Collection Methods
Next, trainees learn about various data collection methods. This might involve learning about surveys, experiments, observations, and secondary data sources, as well as the pros and cons of each method.

Data Cleaning and Preparation
Once data is collected, it often needs to be cleaned and prepared before analysis. This step involves learning how to handle missing data, deal with outliers, and ensure that data is in a suitable format for analysis.

Descriptive Statistics
Trainees are then introduced to descriptive statistics, which summarize and describe data. This includes measures of central tendency like the mean, median, and mode, as well as measures of variability like range, variance, and standard deviation.

Inferential Statistics
The next step is learning about inferential statistics, which involve making predictions or inferences about a population based on a sample of data. This might involve learning about hypothesis testing, correlation, regression, and various statistical tests.

Data Visualization
Visualization is a key part of data analysis, as it helps to communicate findings effectively. This step involves learning about different types of charts and graphs, as well as tools for creating visualizations, such as Tableau.

Interpretation and Reporting
The final step in data analysis is interpreting the results and reporting them. This involves learning how to draw conclusions from statistical analyses, as well as how to communicate these results to others, both in writing and verbally.

Practice and Application
Throughout the training process, trainees should have opportunities to practice these skills on real or simulated datasets. This could involve completing exercises, working on projects, or analyzing case studies.

Ongoing Learning and Development
Data analysis is a rapidly evolving field, so it's important for trainees to continue learning and developing their skills even after the training program is complete. This might involve learning about more advanced techniques, or keeping up with new tools and software as they emerge.

WHAT WE DO
Top-rated Services For Our Clients

Consultation
We help you make the best decision on what will be the best-suited solution required for your company's needs to drive successful growth.
Implementation
Customizing solutions specific to your needs is one of our main fortes. We can help you achieve fast results with answers from our highly reputable technical team.

Traning
We not only implement the solution, but we help your team adapt to the process we built for your company.
Smartsheet Product Reseller
In alignment with Smartsheet goals, we help you with your Smartsheet product inquiries, efficiently distribute the specific solution tailored to your needs, support, troubleshoot, and help you with your warranty claims.

WHAT WE DO
Top-rated Services For Our Clients

Consultation
We help you make the best decision on what will be the best-suited solution required for your company's needs to drive successful growth.
Implementation
Customizing solutions specific to your needs is one of our main fortes. We can help you achieve fast results with answers from our highly reputable technical team.

Traning
We not only implement the solution, but we help your team adapt to the process we built for your company.
Smartsheet Product Reseller
In alignment with Smartsheet goals, we help you with your Smartsheet product inquiries, efficiently distribute the specific solution tailored to your needs, support, troubleshoot, and help you with your warranty claims.

WHAT WE DO
Top-rated Services For Our Clients

Consultation
We help you make the best decision on what will be the best-suited solution required for your company's needs to drive successful growth.
Implementation
Customizing solutions specific to your needs is one of our main fortes. We can help you achieve fast results with answers from our highly reputable technical team.

Traning
We not only implement the solution, but we help your team adapt to the process we built for your company.
Smartsheet Product Reseller
In alignment with Smartsheet goals, we help you with your Smartsheet product inquiries, efficiently distribute the specific solution tailored to your needs, support, troubleshoot, and help you with your warranty claims.


Our Goal Is To Provide You Best Solution made possible
We know how to deliver the top Solutions tailored to your company’s needs to meet your expected requirements. See what other special offers we have available.
- Create business impact by helping you customized the specific Smartsheet solution you need.
- Always provide the cost-effective, scalable and flexible services.
Our Goal Is To Provide You Best Solution made possible


We know how to deliver the top Solutions tailored to your company’s needs to meet your expected requirements. See what other special offers we have available.
- Create business impact by helping you customized the specific Smartsheet solution you need.
- Always provide the cost-effective, scalable and flexible services.
Smartsheet integration
Connect all your technological applications with Smartsheet


















Smartsheet integration
Connect all your technological applications with Smartsheet


Stay Connected with our team
Stay informed with the latest offers, trends, and updates about Smartsheetproducts and solutions.

